International energy projections through 2035


World energy consumption


World energy markets by fuel type

World delivered energy use by sector

Residential and commercial buildings


World energy consumption


Summary


  • In the IEO2010 Reference case, which does not include prospective legislation or policies, world energy consumption grows by 49 percent from 2007 to 2035.
  • Total world energy use rises from 495 quadrillion British thermal units (Btu) in 2007 to 590 quadrillion Btu in 2020 and 739 quadrillion Btu in 2035
  • The most rapid growth in energy demand from 2007 to 2035 occurs in nations outside the Organization for Economic Cooperation and Development (non- OECD nations)
    • Total non-OECD energy consumption increases by 84 percent in the Reference case, compared with a 14-percent increase in energy use among OECD countries

Back to Top

World energy consumption (quadrillion Btu)


World energy markets by fuel type


Overall


  • The IEO2010 Reference case projects increased world consumption of energy from all fuel sources over the 2007-2035 projection period
  • Fossil fuels are expected to continue supplying much of the energy used worldwide
  • Although liquid fuels remain the largest source of energy, the liquids share of world energy consumption falls from 35 percent in 2007 to 30 percent in 2035, as projected high world oil prices lead many energy users to switch away from liquid fuels when feasible

Back to Top

World energy use by fuel type (quadrillion Btu)


Liquid Fuels


  • Liquids remain the world's largest energy source throughout the IEO2010 Reference case projection, given their importance in the transportation and industrial end-use sectors
  • On a global basis, liquids consumption remains flat in the buildings sector, increases modestly in the industrial sector, but declines in the electric power sector as electricity generators react to rising world oil prices by switching to alternative fuels whenever possible. In the transportation sector, despite rising prices, use of liquid fuels increases by an average of 1.3 percent per year, or 45 percent overall from 2007 to 2035

Back to Top

World liquids production (million barrels per day)


Natural Gas


  • Consumption worldwide increases by 44 percent in the Reference case, from 108 trillion cubic feet in 2007 to 156 trillion cubic feet in 2035
  • The industrial sector currently consumes more natural gas than any other end-use sector, and in the projection it continues as the largest user through 2035, when 39 percent of the world's natural gas supply is consumed for industrial purposes

Back to Top

Net change in world natural gas production by region (trillion cubic feet)


Coal


  • In the absence of national policies and/or binding international agreements that would limit or reduce greenhouse gas emissions, world coal consumption is projected to increase from 132 quadrillion Btu in 2007 to 206 quadrillion Btu in 2035, at an average annual rate of 1.6 percent
  • Much of the projected increase in coal use occurs in non-OECD Asia, which accounts for 95 percent of the total net increase in world coal use from 2007 to 2035

Back to Top

World coal consumption by region (quadrillion Btu)


Electricity


  • World net electricity generation increases by 87 percent in the Reference case, from 18.8 trillion kwh in 2007 to 25.0 trillion kwh in 2020 and 35.2 trillion kwh in 2035
  • Although the recession slowed the growth in electricity demand in 2008 and 2009, growth returns to pre-recession rates by 2015
  • Much of the world increase in renewable electricity supply is fuelled by hydropower and wind power
  • Typically, government incentives or policies provide the primary support for construction of renewable generation facilities.
  • Although they remain a small part of total renewable generation, renewables other than hydroelectricity and wind-including solar, geothermal, biomass, waste, and tidal/wave/oceanic energy-do increase at a rapid rate over the projection period

Back to Top

World net electricity generation by fuel (trillion kwh)


World renewable electricity generation by energy source, excluding wind and hydropower (billion kwh)


World delivered energy use by sector


Industry


  • The industrial sector uses more energy globally than any other end-use sector, currently consuming about 50 percent of the world's total delivered energy
  • Energy is consumed in the industrial sector by a diverse group of industries-including manufacturing, agriculture, mining, and construction-and for a wide range of activities, such as processing and assembly, space conditioning, and lighting
  • Worldwide, projected industrial energy consumption grows from 184 quadrillion Btu in 2007 to 262 quadrillion Btu in 2035

Back to Top

World delivered energy consumption in the industrial sector (quadrillion Btu)


Transportation


  • Energy use in the transportation sector includes the energy consumed in moving people and goods by road, rail, air, water, and pipeline
  • The transportation sector is second only to the industrial sector in terms of total end-use energy consumption
  • Almost 30 percent of the world's total delivered energy is used for transportation, most of it in the form of liquid fuels
  • The transportation share of world total liquids consumption increases from 53 percent in 2007 to 61 percent in 2035 in the IEO2010 Reference case, accounting for 87 percent of the total increase in world liquids consumption

Back to Top

World delivered energy consumption in the transportation sector, 2005-2035 (quadrillion Btu)


Residential and commercial buildings


  • The buildings sector-comprising residential and commercial consumers-accounts for about one-fifth of the world's total delivered energy consumption

  • In the residential sector, energy use is defined as the energy consumed by households, excluding transportation uses
    • The type and amount of energy used by households vary from country to country, depending on income levels, natural resources, climate, and available energy infrastructure

  • Typical households in OECD nations use more energy than those in non-OECD nations, in part because higher income levels in OECD nations support purchases of larger homes and more energy-using equipment.

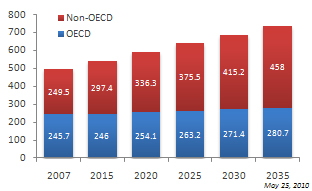
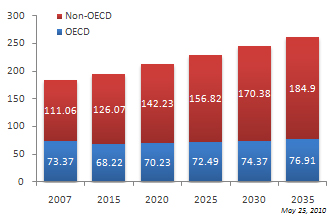
  • In the IEO2010 Reference case, world residential energy use increases by 1.1 percent per year over the projection period, from 50 quadrillion Btu in 2007 to 69 quadrillion Btu in 2035
    • Much of the growth in residential energy consumption occurs in non-OECD nations, where robust economic growth improves standards of living and fuels demand for residential energy

  • Non-OECD residential energy consumption rises by 1.9 percent per year, compared with the much slower rate of 0.4 percent per year for OECD countries, where patterns of residential energy use already are well established, and slower population growth and aging populations translate to smaller increases in energy demand

Back to Top